
Vocational Rehabilitation Self-Employment Guide
Chapter 7:
The Financial Plan

Introduction
The financial plan shows how much money you will spend and how much money you expect to earn in your new business. It will help you make sure you have enough money to run your business and cover your business costs. Lenders and investors will use the financial plan to decide if they want to give you a loan or invest in your business. It also helps you plan business activities, like stocking supplies, purchasing equipment, and deciding what to charge for your service or product.
Financial Plan Sections
The financial plan has several parts, which are covered in this chapter:
- Up-front cash needs
- Break-even analysis and pricing
- Sales forecast
- Cash flow statement
- Income statement
- Balance sheet
These sections build on one another, so if something in one section changes, you might have to go back and change other sections too.


Using the Financial Plan
A good financial plan will help your business succeed. It shows you how your business is doing and allows you to see any differences between what you planned and what actually happens. You can then use this information to adjust your prices and costs.
This chapter will help you complete the Financial Plan section on the Business Plan Outline you downloaded in Chapter 4.
Up-Front Cash Needs
To get started, you need to figure out your up-front cash needs. This is the money you need to get your business started. This includes the money to set up the business before it can open, and the money needed to run and cover business expenses until you earn a profit. It can take several months to a year for a new business to become profitable.
There are two types of up-front cash:
- Pre-opening costs
- Post-opening costs


Pre-Opening Costs
Pre-opening costs are things you pay for while you’re setting up your business before opening. These are costs you estimated in the Start-up Costs Estimates Worksheet from “Chapter 3: Business Feasibility.” They include:
- Production and service costs
- Materials and supplies to make your product or provide your service
- Inventory – products you’ve made or purchased to sell
- Capital equipment – big items like machines that last a year or more
- General supplies – everyday things you use in your business, but they aren’t used to make your product
- Physical space costs
- Furniture, displays, or shelving
- Remodeling costs – setting up or changing your workspace
- Rent or mortgage payments for business set up and first month’s rent
- Utilities for business set up and the first month
- Marketing costs
- Creating marketing materials (logos, website, etc.)
- Ads or promotions for grand opening
- Signs
- Business management costs
- Business license, registrations, and permits
- Legal and accounting fees to set up your business
- Insurance
Update your Start-up Costs Estimates Worksheet from Chapter 3 to estimate your pre-opening expenses.
Post-Opening Costs
Post-opening costs are things you pay for once your business is open and running. They include:
- Inventory and production costs
- Wages
- Rent and utilities
- Replacing or repairing equipment
- Advertising or marketing
- Accounting services and insurance
- Taxes and other expenses
You usually estimate these costs on a monthly, quarterly, or yearly basis. For example, you pay wages, rent, and utilities each month. Insurance and taxes are often paid quarterly or twice a year. You will develop a detailed estimate of these costs when you create a cash flow statement, which we will cover later.


Funding
When you have enough money to pay for your pre- and post-opening expenses, with some money set aside for emergencies, your business is considered capitalized. This means your business can stay open until you start making a profit.
Figuring out how much money you need upfront can be tricky, so it’s important to have a good estimate. You need to know how much of your own savings you’ll use and how much money you’ll need from other sources.
Sources of Cash
You can get funds to start your business from different places, like:
- Personal savings
- Loans – from banks, lines of credit, or friends and family
- Investors – angel investors, venture capitalists, Vocational Rehabilitation, friends, or family
- Grants – small business incubators and other private or government grant programs
- Gifts – crowdfunding, friends, and family
You can find more details about these sources of cash in “Chapter 8: Resources.” For more help, you can ask a small business development advisor for more ideas.


Trade or Barter
To lower costs, you can trade or barter with other business owners or people. Think about the help you need and what skills or talents you can offer in exchange. These could be professional skills related to your business or other talents unrelated to your business.
For example, you could trade some home-cooked meals or babysitting for help with transporting and setting up shelving units. Or you could trade music lessons for bookkeeping assistance for your business. These types of trades can lower the amount of cash you need to pay your bills.
Use the “Return to tabs” button below to jump to the tab navigation bar.
Then continue by selecting the next tab in the list.
Break-Even Analysis
A break-even analysis helps you figure out when your business will become profitable.
- First, it helps you figure out how much product or service you must sell to cover your variable operating costs and fixed costs to break even.
- Second, it helps you figure out how much more you need to sell to make a profit, not just cover your costs.
The break-even analysis is like the cost-evaluation exercise you completed in “Chapter 3: Business Feasibility,” but it is more detailed. This section will cover how to do a break-even analysis.
Pricing
The first step in a break-even analysis is to think about the price you will charge for your product(s) or service(s). You will need to consider how much other businesses charge and how much customers are willing to pay.
How you price your product or service will affect how much you sell. For example, higher prices often mean fewer sales. Doing research on your industry can help you figure out how much people are willing to pay.
Check out How to Price a Product or Service from the Bank of America and How to Price Your Products from Inc.com for more ideas.
Price Points
It is a good idea to think about how different prices will affect both sales and profits. Identify a low, medium, and high price for your product. Once you start your business, you’ll learn more about what customers are willing to pay. Understanding how prices affect sales will help you set sales targets, or the amount you must sell each month to cover costs.

Pricing a Service
Pricing a service can be trickier than pricing a product. For example, it can be hard to track costs like materials, labor, and fixed costs for a lawn care business. Instead, you can set a price for your time working, like hourly or per project. To do this, research your industry for:
- Rates for similar services
- Billing methods – per hour or per project
- Who pays for materials – the customer or the business owner
Check out 5 Tips for Pricing Your Services When You’re Self-Employed from zenbusiness.com and What’s Your Time Worth? How to Determine Your Hourly Rate from Handyman Startup for more tips on how to price a service.
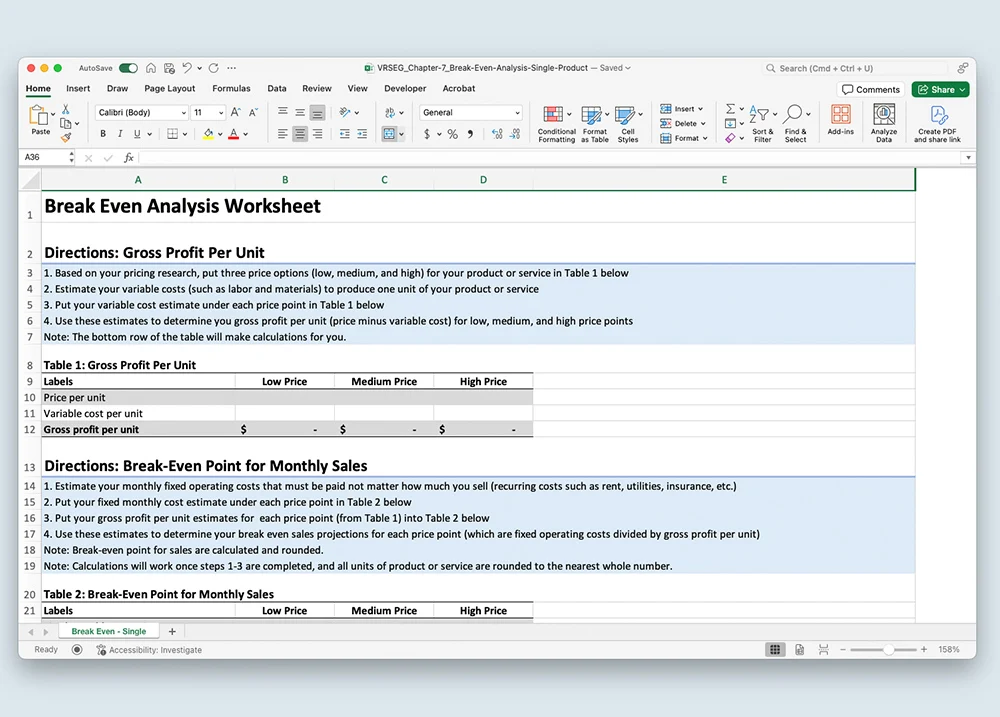
Conducting a Break-Even Analysis
Once you choose a price or a few price options, you can conduct a break-even analysis to find out how much you need to sell to cover costs and make a profit. To do so, follow these steps:
- Step 1: Estimate your variable and fixed operating costs
- Step 2: Estimate your gross profit for each unit of product or service sold
- Step 3: Find your break-even point (the number of sold units needed to cover costs)
- Step 4: Estimate extra units needed to sell and reach your profit goal
These steps are detailed below. You can use the Break-Even Analysis Spreadsheet linked at the end of this section to calculate your own break-even point for three different prices.


Step 1: Variable and Fixed Operating Costs
First, figure out your per-unit variable costs and monthly fixed operating costs.
- Variable costs are the costs needed to produce and sell your product or service, like materials, labor, and delivery costs.
- Fixed operating costs are costs you always pay and generally recur, even if you don’t sell anything, like rent, utilities, or insurance.
You already estimated these costs in “Chapter 6: The Operations Plan.”
Step 2: Gross Profit Per Unit
To figure out your gross profit per unit, you need to find the price you will charge for a unit of your product or service and subtract your variable costs for producing it.
price per unit – variable costs per unit = gross profit per unit
For example, if you sell a product for $20 and the cost to produce it is $12, your gross profit per unit is $8.
$20 (price per unit) – $12 (variable costs per unit) = $8 (gross profit per unit)


Step 3: Determining Your Break-Even Point
The break-even point is when you sell enough units of your product or service to exactly cover your variable and fixed operating costs. To find your break-even point, divide your fixed costs by your gross profit per unit.
fixed costs ÷ gross profit per unit = break-even point
Your business will break even when the gross profit you make from sales exactly covers your fixed operating costs.
For example, if your fixed operating costs are $800 per month, and your gross profit per unit is $8, you would need to make and sell approximately 100 units of your product or service to break even.
$800 (monthly fixed costs) ÷ $8 (gross profit per unit) = 100 units sold (break-even point)
If you sell more than the break-even number (for example, if you sell 110 units), you will make a profit. If you sell less than the break-even point (for example, if you sell 90 units), you will lose money.
Step 4: Profit Sales Goals
To achieve business growth, you can’t just break-even each month. You need to earn a profit, also known as a profit sales goal. This is the number of additional units of a product or service you need to sell to make a profit.
profit goal ÷ gross profit per unit = profit sales goal
For example, if you want to make $160 a month in profit (your profit goal), and your gross profit is $8, you need to make and sell an additional 20 units of your product or service to reach your profit goal. Your profit goal is a dollar amount, and your profit sales goal is the number of extra units you need to sell to reach that goal.
$160 (profit goal) ÷ $8 (gross profit per unit) = 20 additional units sold (profit sales goal)
The following example shows all these steps for Jean’s Jewelry.


Example: Jean’s Jewelry
Jean is starting a jewelry business. She is starting with earrings since they are relatively easy to make and sell. She does the following break-even analysis.
Step 1: Jean’s Variable and Fixed Operating Costs
Variable costs: Jean estimated her variable costs for producing one pair of earrings, including labor, materials, packaging, and shipping costs. This is shown in Table A. She added these costs together and found that it will cost about $13.50 to make and sell one pair of earrings.
Table A: Variable Costs to Produce a Pair of Earrings
| Variable Costs | Amounts |
|---|---|
| Labor = ½ hour @ $9.00/hour | $4.50 |
| Silver | $5.00 |
| Semi-precious stones | $3.00 |
| Shipping costs | $0.75 |
| Box/packaging | $0.25 |
| Total variable costs per unit | $13.50 |
Fixed monthly operating costs: Next, Jean estimated her fixed monthly operating costs (costs she must always pay), including her rent, utilities, insurance, taxes, and other costs. This is shown in Table B. Jean estimated her fixed monthly costs at $885.
Note: Jean’s fixed costs include an owner’s draw, or an amount to help cover some of her personal expenses.
Table B: Fixed Monthly Operating Costs for Jean’s Jewelry
| Fixed Operating Costs | Amounts |
|---|---|
| Rent (partial rent for home work space) | $200.00 |
| Utilities | $50.00 |
| Phone | $50.00 |
| Office supplies | $30.00 |
| Insurance | $25.00 |
| Advertising/promotion | $40.00 |
| Taxes | $40.00 |
| Owner’s Draw | $300.00 |
| Craft fair expenses | $150.00 |
| Total fixed costs per month | $885.00 |


Step 2: Jean’s Gross Profit per Unit
Jean’s variable costs per pair of earrings is $13.50 (the amount of money needed to make one pair of earrings). To earn a gross profit, she needs to charge more than $13.50. Jean researched competitive jewelry prices at craft fairs. Based on what she found, she estimated her gross profit per unit for three different price points ($20, $25, and $30 per pair of earrings). She used the following formula to make calculations in Table C.
sales price per unit – variable costs per unit = gross profit per unit
Table C: Gross Profit Per Unit
| Gross Profit Parts | Low Price | Medium Price | High Price |
|---|---|---|---|
| Sales price per unit | $20 | $25 | $30 |
| Variable costs per unit | $13.50 | $13.50 | $13.50 |
| Gross profit per unit | $6.50 | $11.50 | $16.50 |
As the calculations show, charging a higher price will increase the gross profit per unit sold. At a price of $20 per pair of earrings, gross profit per unit is $6.50. At $25 per pair of earrings, gross profit per unit is $11.50. And at $30 per pair of earrings, gross profit per unit is $16.50.
Step 3: Jean’s Break-Even Point
Jean’s break-even point is the number of earrings she must sell each month to cover both her variable and fixed costs. Depending on the price she charges and the gross profit she earns, Jean will have to make and sell different numbers of earrings to cover her monthly fixed costs.
She used the following calculation to figure out the break-even point for her low, medium, and high price points in Table D.
fixed costs ÷ gross profit per unit = break-even point
Table D: Break-Even Point
| Break-Even Point Parts | Low Price | Medium Price | High Price |
|---|---|---|---|
| Sales price per unit | $20 | $25 | $30 |
| Monthly fixed costs | $885.00 | $885.00 | $885.00 |
| Gross profit per unit | $6.50 | $11.50 | $16.50 |
| Break-even point (number of units to sell) | 136 | 77 | 54 |
If Jean charges $20 per pair, she will need to make and sell 136 pairs of earrings to cover her fixed costs. If she charges $25 per pair, she will need to make and sell 77 pairs of earrings. If she charges $30 per pair, she will need to make and sell 54 pairs.
Keep in mind, although Jean may have to sell fewer pairs of earrings if she charges $30, she may not have enough customers willing to pay that much.
Note: The number of units to sell are rounded to the nearest whole number, since it doesn’t make sense to sell 136.15 pairs of earrings.


Step 4: Jean’s Profit Sales Goals
Jean wants to earn $150 in profit per month to pay down a loan and upgrade her equipment. To figure out how many additional pairs of earrings she must sell to make a profit, she uses the following formula to make calculations in Table E:
profit goal ÷ gross profit per unit = profit sales goal
Table E: Profit Sales Goal
| Profit Goal Parts | Low Price | Medium Price | High Price |
|---|---|---|---|
| Sales price options | $20 | $25 | $30 |
| Profit goal per month | $150.00 | $150.00 | $150.00 |
| Gross profit per unit | $6.50 | $11.50 | $16.50 |
| Profit sales goal (additional units to sell) | 23 | 13 | 9 |
If Jean sells her earrings at different prices, here’s how many pairs she needs to sell each month:
- At $20 per pair: Jean needs to sell a total of 159 pairs of earrings each month (136 to break even and 23 to meet her profit goal).
- At $25 per pair: Jean needs to sell a total of 90 pairs of earrings each month (77 to break even and 13 to meet her profit goal).
- At $30 per pair: Jean needs to sell a total of 63 pairs of earrings each month (54 to break even and 9 to meet her profit goal).
Multiple Products
In this example, Jean is selling one product– earrings. The calculations can get a little more complicated when selling multiple products or services at different prices. For example, if Jean sells different types of jewelry, like earrings, bracelets, and necklaces, she needs to find the gross profit for each type of product or service and figure out how much of her monthly fixed costs each type of item will cover when sold.

Putting it all Together
We have included two break-even analysis spreadsheets (one for a single product with different price points, and one for multiple products) for you to download, save, and use. Each spreadsheet is available in two formats – one for Microsoft Excel and one for Google Sheets.
- If you don’t have Microsoft Office Excel, you can use Google Sheets for free via Google Drive.
- If you use a screen reader, we recommend a free version of the NVDA screen reader software, which does a better job navigating the tables.
- We have also included examples of each spreadsheet for Jean’s Jewelry to help you follow along while doing your own break-even analysis.
Break-Even Analysis Spreadsheets – One Product or Service (With Low, Medium, and High Price Points)
Break-Even Analysis Spreadsheet – Multiple Products
Use the “Return to tabs” button below to jump to the tab navigation bar.
Then continue by selecting the next tab in the list.
Sales Forecast
The break-even analysis helps you set prices and sales goals. A sales forecast, on the other hand, estimates what you might sell over a set period (typically 1 to 3 years). These estimates are based on other similar businesses. Remember, these are just estimates because you haven’t started your business yet and do not have actual sales!

Developing a Sales Forecast
You can figure out your sales forecast in several ways. We cover two here:
- Average sales: Look at average sales for similar businesses in similar locations to get a rough idea of your expected sales.
- Sales breakdown: You can break down your sales by month and account for changes in sales during business start-up or due to seasonal differences.
It’s a good idea to use both methods to estimate future sales. The more information you gather, the more accurate your sales forecast will be!
Once your business is up and running, your sales forecast will improve because it will be based on actual sales from past years.
Average Sales
When you start a new business, you might not know what your sales will look like. A good way to estimate is by looking at average sales for similar businesses in similar areas. Keep in mind, you probably won’t hit those averages right away. Sales usually start slow and pick up as more people hear about your business.
Check out the University of Minnesota Extension’s Assess Demand for a Proposed Community Business resource for more details and instructions on how to use the Economic Census to estimate your potential sales.


Sales Breakdown
It is useful to break down sales by month for your first year of business so that your estimates are more accurate. This method allows you to account for growth as your customer base builds and for seasonal changes in sales. For example, a small craft business that sells mittens made from old sweaters will likely have higher sales in winter and before Christmas compared to spring and summer months.
You can also break down sales by specific products or services to get estimates of each.
Example: Carl’s Lawn and Grounds Services
Carl is starting a lawn and grounds-keeping business. He plans to offer lawn mowing, snow removal, raking/grounds clean-up, and fertilizing services. He researched other similar businesses in his area to come up with an average price for each of these services:
- Lawn mowing – $40 per job
- Snow removal – $25 per job
- Raking/grounds clean-up – $90 per job
- Fertilizing – $75 per job
He expects that demand for his different services will change based on the season. He also expects that his number of customers will increase over time as his business begins to grow.


Snow Removal – 1st Quarter
Carl plans to start his business in November. The only service he expects to provide during the first three months is snow removal. He has 10 customers lined up for November, but he expects to have more customers in December and January. Based on talking with other snow removal businesses in the area, he estimates 3 snow removal jobs per customer in November and 5 per customer in December and January.
Table F shows his sales forecast for snow removal services in November, December, and January.
Table F: Snow Removal Sales Forecast for November, December, and January
| Snow Removal Details | Nov | Dec | Jan |
|---|---|---|---|
| Price per snow removal | $25 | $25 | $25 |
| Number of customers | 10 | 15 | 18 |
| Units sold per month per customer | 3 | 5 | 5 |
| Monthly snow removal sales | $750 | $1,875 | $2,250 |
Notice that:
- Monthly sales = price × number of customers × units sold to each customer per month.
- The number of customers grows over time as the business expands.
- Units sold vary across months to adjust for changes in expected snowfall.
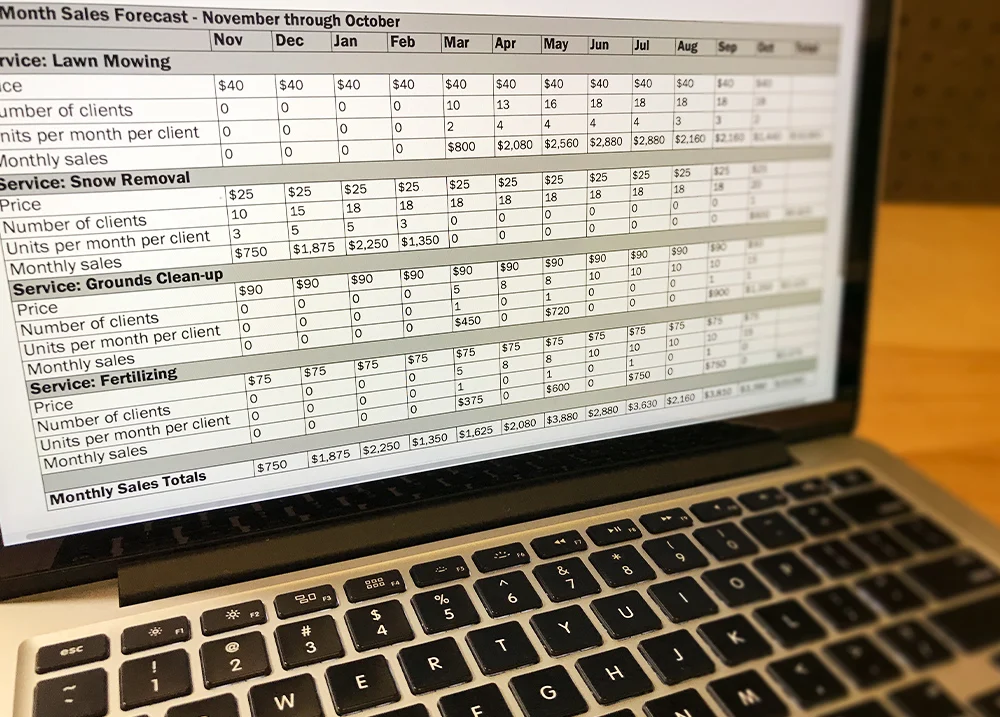
Carl’s 12-Month Sales Forecast
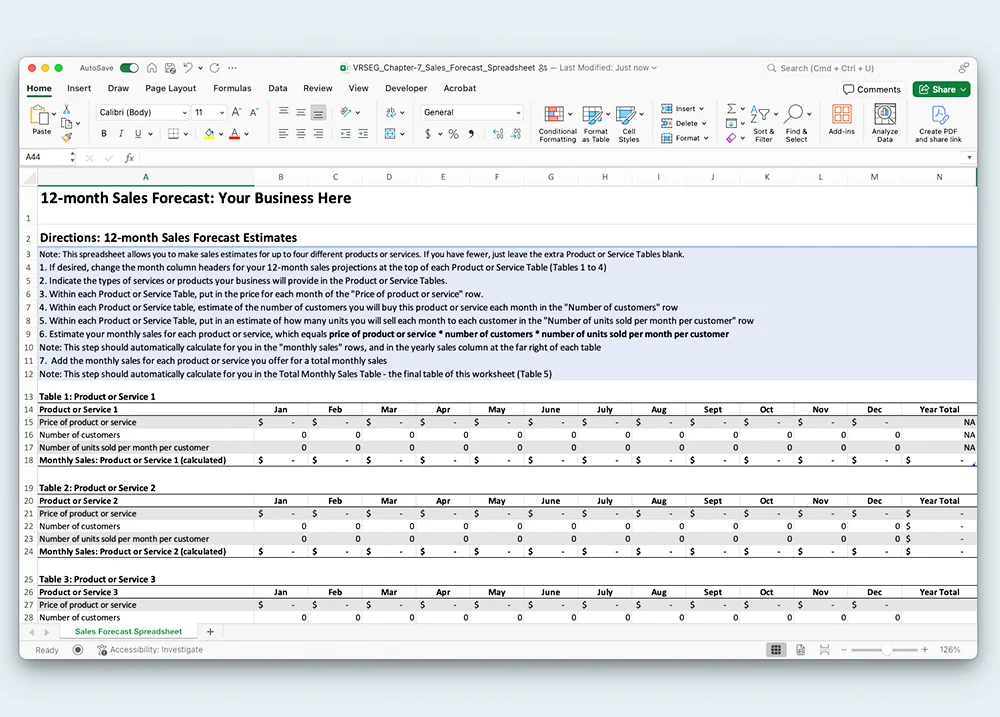
Carl completed sales estimates for all his services for each month of the year using a sales forecast spreadsheet.
First, Carl created a spreadsheet with rows for each of his services and columns for each month of business. For each service and month, he entered the price for each service, number of customers, expected units sold per customer, and monthly sales.
- Carl included estimates for each service: lawn mowing, snow removal, grounds clean-up, and fertilizing. Some services overlapped across months, while others are offered only in a specific month.
- The sales forecast included expected sales by month and for the year.
- Carl totaled everything to get his total sales estimate of $29,580 for the year.
Sales Forecast Spreadsheets
We have included a sales forecast spreadsheet for you to use. The spreadsheet is provided in two different formats – one for Microsoft Excel and one for Google Sheets.
- If you don’t have Microsoft Office Excel, you can use Google Sheets for free via Google Drive.
- If you use a screen reader, we recommend a free version of the NVDA screen reader software, which does a better job navigating the tables.
- We have also included an example spreadsheet for Carl that you can use as a guide.
Sales Forecast Spreadsheets
Example Sales Forecast Spreadsheets
Getting Started
Once you download the sales forecast spreadsheet, you can begin to fill it in. For each of your products or services:
- Enter your product or service price
- Estimate the number of customers you expect to have each month
- Estimate the number of units you expect to sell to each customer each month (this will often be 1)
- The spreadsheet will automatically calculate your monthly sales using this equation:
- price × number of customers × units sold per month = monthly sales
If you are selling more than one product or service, the spreadsheet will calculate the monthly sales for each product or service you enter and show you the total monthly sales at the bottom.

Use the “Return to tabs” button below to jump to the tab navigation bar.
Then continue by selecting the next tab in the list.
Cash Flow
Having enough cash on hand is crucial for business operations. Even if your business is profitable overall, you might not make a profit every month. For example, if most of your sales happen around a holiday like the 4th of July, you may make more money in May, June, and July but lose money in other months. This is important to know because you need to cover your bills and other fixed costs when they are due each month.

Cash Flow Statement
The cash flow statement tracks the money coming into your business (called receipts) and the money going out (called disbursements) over one year. It shows when you’ll receive cash from sales (receipts) and when you’ll need cash to pay your bills (disbursements).
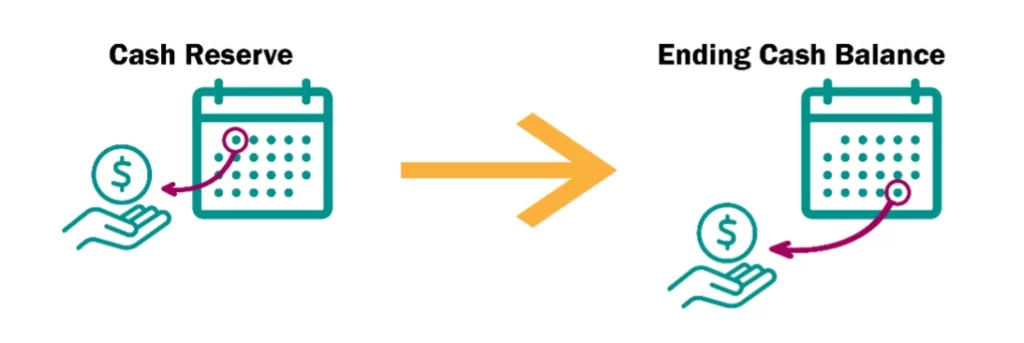
Each month, you start with a cash reserve, or the money you have right now (also called cash-on-hand). Each month, your cash-on-hand reserve will increase if customers purchase your items, but it will decrease when you pay bills. At the end of the month, any money you have left over is your new cash balance. This becomes your cash reserve for the next month.
The parts of a cash flow statement are outlined below.
Cash Reserve
The starting point for a cash flow statement is the cash reserve. It is important to have a large cash reserve when you first start your business. You will use your cash reserve to cover start-up costs and to cover your fixed and variable costs until your business makes enough money to break even.
If your cash reserve goes below zero at the end of the month, it means you have run out of cash on hand and you won’t be able to pay your bills.


Receipts (Money In)
Receipts are the money your business gets from sales or other sources like gifts, grants, or short-term operating loans.
You might not always get paid right away when you sell a product or service. For example, businesses that invoice (or send bills) for sales and services usually get paid the next month. If this is the case, you need to account for this in your cash flow statement. It can get complicated to figure out across multiple months.
Here’s an example of receipts coming in across months.
Receipts Calculations – Green Grass Sprinkler
Table G uses the following information to calculate receipts for a sprinkler installation business for May, June, and July.
- Sales for the first three months are $5,000 for May, $6,000 for June, and $7,000 for July.
- Based on estimates from owners of similar businesses, 50% (half) of the customers pay bills in the same month when the service was received, and 50% (the other half) pay bills the following month. If half of the customers pay in the same month and the other half the next month, the payments will be spread over two months.
Table G: Receipts Calculations
| Sales | May receipts | June receipts | July receipts |
|---|---|---|---|
| May Sales = $5,000 | $2,500 | $2,500 | – |
| June Sales = $6,000 | – | $3,000 | $3,000 |
| July Sales = $7,000 | – | – | $3,500 |
| Total Receipts | $2,500 | $5,500 | $6,500 |


Disbursements (Money-Out)
Disbursements are costs your business must pay. They fall into three categories:
- Variable operating costs: costs that change depending on how much you sell, like materials and labor.
- Fixed operating costs: costs that must be paid each month, whether or not you sell any product or service, like rent and utilities.
- Other expenses: things like loan payments, equipment purchases, owner’s draws, and taxes.
The cash flow statement shows when you pay these costs. Some of these costs are paid every month, such as rent and utilities, and others may be only once or twice a year, like insurance and license fees.
Ending Cash Balance
Your ending cash balance is the amount of money you have left at the end of the month. To figure out the ending cash balance, use this formula:
cash reserve + receipts – total disbursements = ending cash balance
Remember that the ending cash balance for one month becomes the starting cash reserve for the next month. Keep in mind, having money left at the end of the month doesn’t always mean you’re making a profit.
For example, if your cash reserve is $300 in January, $250 in February, and $100 in March, you still have enough cash-on-hand to cover bills, but your cash reserve is decreasing over time, and it may indicate money problems.


Surplus or Deficit
If you are making more money than you are spending each month, then you are in a surplus. On the other hand, if you are spending more money than you are making each month, you are in a deficit.
To see if your business is profitable for the month (surplus) or losing money (deficit), use the following formula:
receipts – total disbursements = surplus (+) or deficit (-)
- A surplus means your receipts are higher than your disbursements, and you’re making a profit.
- A deficit means your disbursements are higher than your receipts, and you’re losing money.
- Keep in mind, you can have a surplus one month but still end up with a loss for the year if other months operate at a deficit.
Ending Cash
Your ending cash for the month is calculated by adding your cash reserve to any surplus or subtracting any deficit for the month.
ending cash = cash reserve + surplus/deficit
If you have a surplus, your ending cash will be greater than your starting cash reserve. If you have a deficit, your ending cash will be less than your starting cash reserve.
The ending cash for the month then becomes the starting cash reserve for the next month.

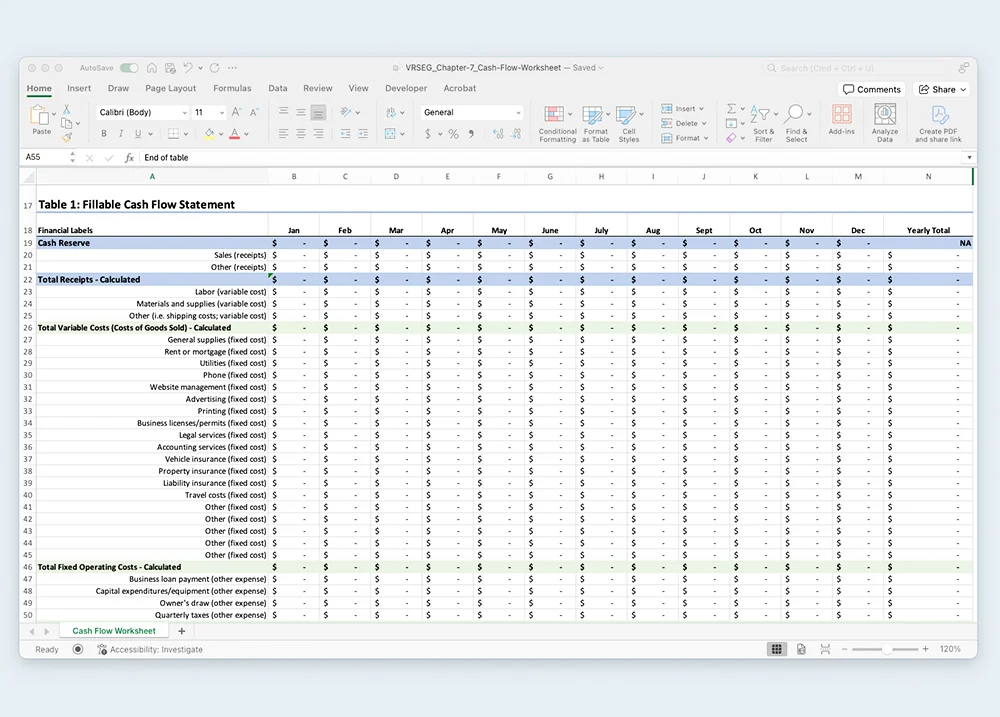
Cash Flow Spreadsheets
We have included a cash flow spreadsheet for you to use. The spreadsheet is provided in two different formats–one for Microsoft Excel and one for Google Sheets.
- If you don’t have Microsoft Office Excel, you can use Google Sheets for free via Google Drive.
- If you use a screen reader, we recommend a free version of the NVDA screen reader software, which does a better job navigating the tables.
- We have also included an example spreadsheet for Gary’s Gutter that you can use as a guide.
Cash Flow Spreadsheet
Example Cash Flow Spreadsheet
Important note: Numbers within parentheses in the spreadsheets represent negative numbers. For example, $(100) is the same as -$100. In Excel, users can change the spreadsheet to show a negative number instead of parentheses by following the steps outlined in this Change the Way Negative Numbers are Displayed article. Google Sheets does not allow users to change from parentheses to a negative number, so please keep this in mind while working in these spreadsheets.
Cash Flow Spreadsheet Tips
Here are some things to keep in mind as you put together your own cash flow statement:
- Ending cash is carried over as the next month’s starting cash reserve.
- Make sure you factor in seasonal changes and business growth when estimating your sales and variable costs (costs of goods sold). This will impact your monthly receipts.
- Record your receipts when they are received and disbursements when you spend money.
- If you invoice customers, sometimes receipts are delayed.
- Likewise, if you are invoiced for materials, you may not pay the invoice right away. For example, payment may be due the following month.
- Estimate all costs as accurately as possible.
- Call utility providers to get installation prices, monthly fees, and projected estimates.
- Call suppliers for prices and credit terms.
- Speak with owners of similar businesses to estimate sales volume and payment delays.
- When in doubt, it is best to underestimate income or receipts and overestimate costs or disbursements.
- This provides a cushion in case of unexpected expenses or delays in payments.
To get an idea of how to fill in a cash flow statement, follow along with the example below.

Example: Gary’s Gutter
Gary has a new rain gutter installation business. Download and print the Cash Flow Statement Example: Gary’s Gutter January-April Spreadsheet to follow along with Gary’s cash flow estimates for January, February, and March.
Gary’s Gutter – January
Gary started his gutter installation business in January. Below is a breakdown of his cash flow for January, February, and March.
- Cash Reserve: His beginning cash reserve was $10,000.
- Receipts: His receipts for January were $0.
- He made $5,000 in sales during the month, but he won’t be paid until February.
- Costs of Goods Sold: Gary’s variable operating costs for January are $2,225. These are the costs related to providing his gutter installation service, including labor and materials.
- Fixed Operating Costs: His fixed operating costs for January are $1,955. These are expenses like rent, utilities, insurance, and advertising – costs that he must pay each month, regardless of sales.
- Other Expenses: He also has $4,909 in additional expenses for January, which include things like loan repayment, expenses for capital (e.g., equipment), owner’s draw, and taxes.
- Total Disbursements: Adding up these three categories (cost of goods sold, fixed costs, and other expenses), Gary’s total disbursements for January come to $9,089.
- $2,225 (cost of goods sold) + $1,955 (fixed costs) + $4,909 (other expenses) = $9,089 (total disbursements)
- Surplus or Deficit: Because Gary didn’t receive any receipts in January, we know he’s operating at a deficit for the month.
- $0 (receipts) – $9,089 (total disbursements) = – $9,089. This is a negative number (deficit) because his total payments are more than his receipts.
- Ending Cash: Next, Gary subtracts the deficit from his starting cash reserve. His starting cash was $10,000, so: $10,000 (starting cash) – $9,089 (deficit) = $911 (ending cash balance)
- This $911 will be Gary’s starting cash for February.


Gary’s Gutter – February
With January behind him, Gary does these same calculations for February.
- Cash Reserve: His beginning cash reserve for February is $911, which was the ending cash balance from January.
- Receipts: His receipts for February are $5,000.
- He receives $5,000 in February from jobs he completed in January.
- He made an additional $5,000 in sales in February, but he won’t be paid for these sales until March.
- Costs of Goods Sold: Gary’s variable operating costs for February are $2,225. These are direct costs related to providing his gutter installation service, including labor and materials.
- Fixed Operating Costs: His fixed operating costs for February are $385. These are expenses like rent, utilities, insurance, and advertising – costs that he must pay each month, regardless of sales.
- Other Expenses: He also has $659 in additional expenses for February, which include things like loan repayment, expenses for capital (e.g., equipment), owner’s draw, and taxes.
- Total Disbursements: Adding these three categories (cost of goods sold, fixed costs, and other expenses), Gary’s total disbursements for February come to $3,269.
- $2,225 (cost of goods sold) + $385 (fixed costs) + $659 (other expenses) = $3,269 (total disbursements)
- Surplus or Deficit: Gary subtracts his total costs from receipts and determines he is operating at a surplus this month
- $5,000 (receipts) – $3,269 (total disbursements) = $1,731. This is a positive number (surplus) because his total receipts are more than his total reimbursements.
- Ending Cash: Now, Gary adds his cash reserve to the equation to determine his ending cash.
- $911 (cash reserve) + $5,000 (receipts) – $3,269 (total disbursements) = $2,642 (ending cash balance)
- This $2,642 will be Gary’s starting cash reserve for March.
Gary’s Gutter – March
Here is one more month of Gary’s cash flow analysis.
- Cash Reserve: Gary’s beginning cash reserve for March is $2,642 (his ending cash balance for February).
- Receipts: His receipts for March are $5,000.
- He receives $5,000 in March from jobs he completed in February.
- He made an additional $5,000 in sales in March, but he won’t be paid for these sales until April.
- Costs of Goods Sold: Gary’s variable operating costs for March are $2,225. These are direct costs related to providing his gutter installation service, including labor and materials.
- Fixed Operating Costs: His fixed operating costs for March are $985. These are expenses like rent, utilities, insurance, and advertising – costs that he must pay each month, regardless of sales.
- His operating costs are higher in March than in February because he had to pay an accountant for helping with his taxes.
- Other Expenses: He also has $659 in additional expenses for March, which include things like loan repayment, expenses for capital (e.g., equipment), owner’s draw, and taxes.
- Total Disbursements: Adding these three categories (cost of goods sold, fixed costs, and other expenses), Gary’s total disbursements for March come to $3,869.
- $2,225 (cost of goods sold) + $985 (fixed costs) + $659 (other expenses) = $3,869 (total disbursements)
- Surplus or Deficit: Gary subtracts his total costs from receipts and determines he is operating at a surplus this month
- $5,000 (receipts) – $3,869 (total disbursements) = $1,131. This is a positive number (surplus) because his total receipts are more than his total reimbursements.
- Ending Cash: Now, Gary adds his cash reserve to the equation to determine his ending cash.
- $2642 (cash reserve) + $5,000 (receipts) – $3,869 (total disbursements) = $3,773 (ending cash balance)
- This $3,773 will be Gary’s starting cash reserve for April.

Use the “Return to tabs” button below to jump to the tab navigation bar.
Then continue by selecting the next tab in the list.
Income Statement
The income statement shows a business’s financial activity over a specific period, usually a year. It shows:
- Total sales
- Costs of goods sold
- Gross profit
- Fixed operating and other expenses
- Net profit
The income statement is very similar to the cash flow statement because both track receipts (money coming in) and disbursements (money going out). The main difference is that the cash flow statement provides a yearly total with month-by-month breakdowns, while the income statement does not. Instead, the income statement gives a summary of whether your business made or lost money over the entire year.
Before your business opens, the income statement shows your best estimates of receipts and disbursements. Once your business is up and running, the income statement uses real numbers to determine your profit or loss. Many businesses work with an accountant to prepare the income statement and calculate taxes based on it.
View the Income Statement Example: Gary’s Gutter Spreadsheet to follow along with the following descriptions of the income statement parts. Notice the example statement covers a specific time period measuring income from January 1, 2024, to December 31, 2024 (one year).

Parts of the Income Statement
The income statement includes several estimates, including total sales, costs of goods sold, gross profit or loss, total fixed operating costs and other expenses, and net profit. These are described in more detail below.
Total Sales
Total sales represent the money earned from selling products or services over a specific period of time. Good financial planning begins with predicting total sales. To do so, you can:
- Survey similar businesses in other locations about their average sales
- Review industry publications for average sales of similarly sized businesses
- Search Small Business Administration (SBA) publications
This information was covered in the Break-Even Analysis and Sales Forecast sections earlier in this chapter.
In Gary’s case, he estimated $72,500 in total sales. He used the information from his cash flow statement to make this estimate (see the Cash Flow Statement Example: Gary’s Gutter Spreadsheet below).


Costs of Goods Sold
Variable operating costs or costs of goods sold are the direct costs to produce your product(s) or service(s). You can use your cash flow statement to estimate your total costs of goods sold for the year. Here are some examples of costs of goods sold for different types of businesses:
- Retail business: The difference between the cost of the starting and ending inventory, plus shipping, packaging, and labor costs directly related to sales.
- Manufacturing business: Costs of raw materials, parts, and labor to manufacture one item, multiplied by the number of items sold.
- Service business: Expenses like labor and supplies for the service. For instance, a lawn mowing business might include labor, gas, and lawn waste disposal costs.
In the example income statement for Gary’s Gutter, the total costs of goods sold was $35,580, which covered labor and materials to complete his jobs for the year.
Gross Profit or Loss
Gross profit is the difference between total sales and the costs of goods sold. To calculate it, subtract your cost of goods sold from your total sales:
total sales – costs of goods sold = gross profit or loss
If sales are more than costs, there is a gross profit. If costs are more than sales, the business is operating at a loss.
In Gary’s Gutter example, he had a gross profit of $32,545. This was calculated by taking the total sales of $68,125 and subtracting the total costs of goods sold of $36,920.


Total Fixed Operating Costs and Other Expenses
Fixed operating costs are expenses that aren’t tied directly to making a product or service. These are things like rent, utilities, salaries, payroll taxes, advertising, insurance, office supplies, repairs and maintenance, and depreciation.
Other expenses are expenses not related to daily business operations, such as payments on loans, capital equipment purchases, or owner’s draw.
You can use estimates from your cash flow statement to estimate your fixed operating costs and other expenses. For Gary, these were $7,880 for fixed operating costs and $19,733 for other expenses, which total $27,613.
Net Profit or Loss
If your business makes more money than it spends, you’re operating at a net profit, which means your business is profitable. If your business spends more money than it makes, you are operating at a net loss, and your business is not profitable.
To figure out if your business is operating at a net profit or loss, subtract your total fixed operating costs and other expenses from your total gross profit.
total gross profit – total fixed operating cost and other expenses = net profit (or loss)
Gary estimated his net profit as $9,307 for the year.


Future Income Statements
Once your business is up and running, your income statements will be based on actual receipts and disbursements, not estimates. These will help you track your business performance over time.
It is a good idea to work with an accountant to make sure your business’s financials and taxes (local, state, and federal taxes) are handled correctly.
Use the “Return to tabs” button below to jump to the tab navigation bar.
Then continue by selecting the next tab in the list.
Balance Sheet
The balance sheet shows how much your business is worth at a specific point in time. It includes your total assets, total liabilities, and the difference between them, called equity. Equity is important when applying for business loans because it shows you have an interest in paying back the loan, like a down payment on a house.
Parts of the Balance Sheet
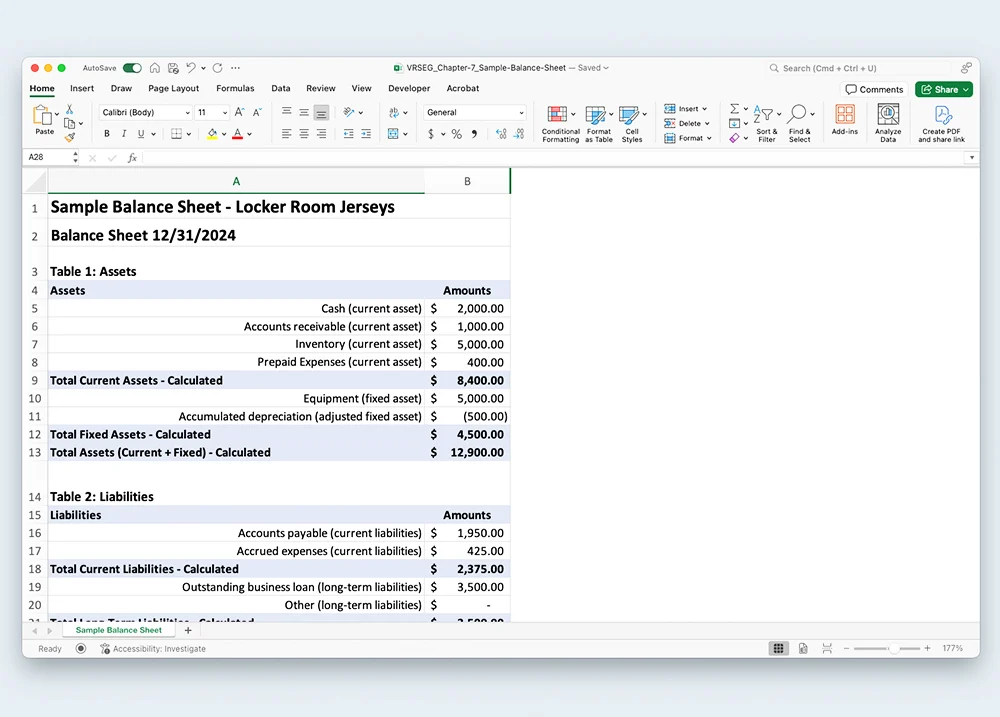
View the Balance Sheet Example: Locker Room Jerseys Spreadsheet to see how the balance sheet is set up.
Total Assets
Total assets are everything your business owns that has a cash value or could be sold for cash. Total assets are broken into two types: current assets and fixed assets.
current assets + fixed assets = total assets
- Current assets include cash, savings, inventory, accounts receivable (money owed to you), and prepaid expenses (like insurance that could be refunded).
- Fixed assets include things like land, buildings, and equipment, which have value but would need to be sold to recover their value When valuing equipment or vehicles, account for depreciation (the loss of monetary value overtime). To learn more, check out What is Depreciation? from profitbooks.net.
Locker Room Jerseys has $8,400 in current assets and $4,500 in fixed assets. Total assets for the business are $12,900.

Total Liabilities
Total liabilities are the money your business owes to other businesses or companies. Total liabilities are divided into two types– current liabilities and long-term liabilities.
current liabilities + long-term liabilities = total liabilities
- Current liabilities are payments that are due immediately, like what you owe to suppliers.
- Long-term liabilities are payments that need to be paid over time, such as long-term loans or a mortgage.
Note: Sometimes liabilities are called “debts.”
Locker Room Jerseys has $2,375 in current liabilities and $3,500 in long-term liabilities. Total liabilities for the business are $5,875.
Equity
Equity is the difference between what a business owns (total assets) and what it owes (total liabilities). Equity is how much your business is worth. You can figure out your business’s equity by subtracting your total liabilities from your total assets.
total assets (what you own) – total liabilities (what you owe) = equity
Locker Room Jerseys has $12,900 in total assets and $5,875 in total liabilities. That leaves $7,025 in equity.
Generally, a new business will create a balance sheet every year to track changes in equity over time.
Use the “Return to tabs” button below to jump to the tab navigation bar.
Then continue by selecting the next tab in the list.
Chapter Review
The Financial Plan outlines your anticipated receipts (cash coming in) and disbursements (cash going out). It shows how you expect your business to grow and make a profit over time. It includes several parts:
- Up-front cash needs: The money needed to start your business and cover costs until the business makes a profit
- Break-even analysis: The amount of product or service you need to sell to cover variable and fixed operating costs
- Sales forecast: A prediction of sales over time
- Cash flow statement: A monthly record of receipts and disbursements to make sure you can pay your bills each month
- Income statement: A yearly statement that shows your anticipated profit or loss
- Balance sheet: A statement that shows your business’s value at any time
Creating your financial plan can be difficult, but if you’ve made it this far, you have some good tools for getting started. There are also business development resources to help you develop a financial plan, which can be found in the final chapter of this website, “Chapter 8: Resources.”

Prepare
First, take a deep breath– developing a financial plan can seem scary, but with research and planning, you can do it!
- Use the Business Plan Outline to track your progress.
- Check out the resources in Chapter 8 to help you.
- Think about getting help on financials from a bookkeeper or accountant, or use a bookkeeping software like QuickBooks.
Up-Front Cash Needs
Start by figuring out your up-front cash needs. How much money will you need to start your business and keep it going until you make a profit?
Then, list possible funding sources, like personal savings, potential loans, or grants. To get most types of loans, you will need a full business plan, so keep working through all the sections in this chapter.

Break-Even Point and Beyond
Next, find your break-even point, or the number of products or services you must sell each month to cover your variable and fixed operating costs. Use the worksheets in the “Break-Even Analysis” tab to help you.
Also, consider pricing. How do changing prices affect your break-even point. Look at your gross profit for different price points and think about what customers are willing to pay.
Finally, keep using the spreadsheets included in this chapter to estimate your sales, cash flow, and income.
Keep Going
If you have made it this far, you have put a lot of work into your business idea. This effort will serve you well if you decide to pursue self-employment. Planning is a very important part of business success!
Don’t get discouraged if you have had trouble working through this material. Business planning is complicated! That is why it is so important to use resources available to you, like Small Business Development Centers, business incubators, business mentors, and other people you know. Also, check out “Chapter 8: Resources” for more ideas.


Circling Back to the Executive Summary
Remember, after you finish developing your business description, marketing plan, operations plan, and financial plan, you need to go back to the executive summary section (see “Chapter 4: The Business Plan”) to write an overview of your full business plan.
A finished business plan will guide you in getting your business up and running. It is also a key document to share with potential funders.
Most business owners use the business plan beyond the start-up phase to track progress and adjust their business operations. A thorough and complete business plan is worth the time and effort.
VR Counselor Tips
Sources of Cash
It is important for consumers to know how much money they need to start their business. How much of their own money can they invest in the business, and how much will they need to get from other funding sources?
Keep in mind, some funding sources will only cover certain expenses. For example, grants may have strict rules on how the funds can be used. Make sure consumers are aware of any funding restrictions, including funds from the VR agency.


Pricing and Break-Even Analysis
Pricing a product or service can be tricky. The price needs to be high enough to cover costs but not so high that it drives customers away. Sometimes, however, a higher price suggests better quality, and in some cases, higher-priced products sell better than lower-priced ones.
A break-even analysis is a more detailed version of the Cost Evaluation Exercise completed in Chapter 3. After choosing a reasonable price, consumers can figure out how much product or service they need to sell each month to make a profit. These sales benchmarks could be used as an indicator for VR case closure.
Sales Forecast & Cash Flow
Many new business owners don’t have enough cash to cover their monthly expenses during start-up. This is known as being undercapitalized. The sales forecast and cash flow statement work together to help the consumer understand:
- How much funding is needed to cover costs during the business start-up phase.
- How many sales are needed to make a profit.
The cash flow statement also shows trends in cash reserve. If ending cash is shrinking over time, the business may be struggling.
Generally, it is a good idea to have a cash reserve to cover six months of fixed and variable operating costs when starting a business. This helps the consumer pay bills during slow sales periods and gives time to build a customer base.


Business Plan
Once the consumer’s business plan is complete, the counselor will be one of the first people to review it critically. Evaluate it from VR and other funders’ perspectives. Should VR fund this business? If not, why? Help connect the consumer with outside assistance if the plan needs improvement.
If the agency supports the business:
- Determine how much VR will contribute.
- Help the consumer explore additional funding sources.
- Update the Individualized Plan of Employment.
- Determine what needs to happen before VR can close the case.
Wrap Up
The Business Plan is a guide to help start, manage, and grow a business. It helps both the counselor and the consumer track business progress and determine if the plan is working as expected.
If costs, sales, and profit are different from the business plan estimates, what changes need to be made?
- Does the consumer need more help with parts of the business?
- Could the consumer reduce costs, such as purchasing less expensive equipment, or working from home rather than renting space?
- Does the consumer need to adjust prices, marketing, or other business management practices to gain more customers?
- Could a business advisor help address certain issues?
- Should the consumer explore other employment options?
Our hope is that through the process of assessing readiness, business feasibility, and developing a solid business plan, consumers who pursue self-employment will be set up for success.

Use the “Return to tabs” button below to jump to the tab navigation bar.
Then continue by selecting the next tab in the list.

Check Your Understanding:
Assessing the Financial Plan
To review your understanding of this chapter’s material, go through the following questions, and then test your knowledge on break-even calculations and reading a cash flow statement.
Financial Plan Questions
Write down your answers to the following questions. Then, check your answers in the “Review Your Answers” accordion.
Up-Front Cash Question
What is up-front cash, and what does it cover?
Break-Even Analysis Question
What does a break-even analysis help you figure out?
Sales Forecast Question
What are some things you should think about when you are putting together your sales forecast?
Cash Flow vs. Income Statement Question
How is the cash flow statement different than the income statement?
Tracking Cash Flow Question
Why is cash flow important to keep track of throughout the year?

Open the “Review Your Answers” accordion to compare your answers.
Review Your Answers

Up-Front Cash Answer
Question: What is up-front cash, and what does it cover?
Answer: Up-front cash is the money you need to get your business up and running. It includes cash to pay pre-opening expenses and post-opening expenses until your business can earn a profit.
Break-Even Analysis Answer
Question: What does a break-even analysis help you figure out?
Answer: A break-even analysis helps you determine how many units of a product or hours of service you must sell to break even and start making a profit. It can also show how changing a product’s price or reducing expenses changes your gross profit and the number of units one must sell to break even.

Sales Forecast Answer
Question: What are some things you should think about when you are putting together your sales forecast?
Answer: You should consider:
- Average sales for similar businesses in your area. Use this information to reference what your sales might be once you get established.
- How sales might change over the year based on seasonal demand for your product or service.
- How sales might increase over time as your business gains more customers through advertising and word of mouth.
Cash Flow Statement vs. Income Statement Answer
Question: How is the cash flow statement different from the income statement?
Answer: The cash flow statement is a record of your receipts (cash coming in) and disbursements (cash going out) each month. It is calculated based on estimates of your sales, costs of goods sold (variable costs), fixed operating costs, and other expenses. It shows when your business will make money (receipts) and when you need to pay bills (disbursements).
The income statement shows a business’s financial activity over a specific period, usually one year. It shows total sales, costs of goods sold, gross profit, fixed operating and other expenses, and net profit. These estimates will be very similar to the yearly totals generated on the cash flow statement.
The income statement is different from the cash flow statement, however, because it is not broken down month-by-month. Instead, it shows your total revenue and costs for the entire year. The income statement compares business expenses with revenues so you can see if your business made or lost money each year.


Tracking Cash Answer
Question: Why is cash flow important to keep track of throughout the year?
Answer: Even if your business is profitable over a year, that doesn’t mean you made a profit every month. This is important to know because you need to be able to pay your bills and other fixed costs each month.
For example, think about a business that makes knitted wool scarves. Most sales for wool scarves will take place in the winter and over the holiday season. This means that cash reserves from March to October might be needed to cover business costs until sales increase in November, December, January, and February.

Scenario 1: Break-Even Analysis
Parker’s Tasty Dog Treats Break-Even Analysis
Parker is starting a business making gourmet dog treats. He plans to sell them in local pet shops and directly to individual pet owners at craft fairs and online. He wants to know how many bags of treats he will need to sell to cover all of his costs, and how many to sell to make a profit.
You will need the following information to answer the questions:
- The variable costs for producing one bag of dog treats are $5 (costs for labor and materials).
- Fixed costs per month are $600, which include use of a commercial rental space, insurance, advertising, taxes, and an owner’s draw.
- Parker is planning to sell his dog treats for $10 per bag.
- Parker’s profit goal per month is $100.
Gross Profit Question
Using the following gross profit calculation, what is Parker’s gross profit per bag of dog treats?
price per unit – variable costs per unit = gross profit per unit
Break-Even Point Question
Using the following break-even point calculation, how many bags of dog treats does Parker need to sell to break even?
fixed costs ÷ gross profit per unit = break-even point (number of units to sell each month)
Profit Sales Goals Question
Using the following profit sales goal calculation, how many additional bags of treats does Parker need to sell to reach his $100 profit goal?
profit goal ÷ gross profit per unit = profit sales goal (additional units to sell)
Total Sales Question
How many (total) bags of dog treats does Parker need to sell to break even and reach his profit goal?
Open the “Parker’s Break-Even Analysis” accordion below to check your answers.
Parker’s Break-Even Analysis

Gross Profit Answer
At a sales price of $10, Parker’s gross profit per unit is $5 per unit (or bag of treats). Parker subtracted his variable costs per unit ($5) from his price per unit ($10) to figure out his gross profit per unit.
$10 (price per unit) – $5 (variable costs per unit) = $5 (gross profit per unit)
Break-Even Point Answer
At a sales price of $10, Parker needs to sell 120 bags of dog treats per month to break even. Parker divided his monthly fixed costs ($600) by his gross profit per unit ($5) to figure out his break-even point.
$600 (fixed costs) ÷ $5 (gross profit per unit) = 120 bags of dog treats (break-even point)

Profit Goal Sales Answer
At a sales price of $10, Parker needs to sell an additional 20 bags of dog treats. Parker divided his monthly profit goal ($100) by his gross profit per unit ($5) to arrive at the number of additional dog treat bags he needs to sell to meet his profit goal.
$100 (profit goal) ÷ $5 (gross profit per unit) = 20 bags of dog treats (profit sales goal)
Total Sales Answer
If Parker charges $10 per bag of treats, he needs to sell a total of 140 bags per month to cover his costs and make a $100 profit. Parker added the number of units he needs to sell to break even (120 bags of dog treats) with the number of units he needs to reach his profit goal (20 bags of dog treats) to figure out the total number he needs to sell each month.
Scenario 2: Cash Flow Statement
Parker’s Cash Flow Statement
Parker developed a cash flow statement for the first six months of his business.
- Parker began his business in May with a $3,600 loan.
- He must repay this loan at a rate of $150/month after three months.
- Parker is going to sell his dog treats to pet stores for $10 per bag. As he starts out, Parker is asking for payment upon delivery, so there are no delays in receipts.
- He plans to take a $100 owner’s draw every month.
Download and print the Cash Flow Statement Example: Parker’s Dog Treats Spreadsheet to answer the questions. Review the “Parker’s Cash Flow Answers” accordion below to check your answers.
Important note: Numbers within parentheses in the spreadsheets represent negative numbers. For example, $(100) is the same as -$100. In Excel, users can change the spreadsheet to show a negative number instead of parentheses by following the steps outlined in this Change the Way Negative Numbers are Displayed article. Google Sheets does not allow users to change from parentheses to a negative number, so please keep this in mind while working in these spreadsheets.

Receipts Question
Parker’s receipts are increasing over time. What does this show?
Surplus or Deficit Question
In what months does Parker earn a surplus (where total receipts are greater than total disbursements)?
Cash Reserve Question
How much cash reserve will Parker have in November?
6-Month Profit or Loss Question
What is Parker’s profit or loss during the first six months?
Open the “Parker’s Cash Flow Answers” accordion below to check your answers.
Parker’s Cash Flow Answers

Receipts Answer
Parker’s receipts are increasing over time. What does this show?
Parker’s increasing receipts show that his business is growing and he is selling more dog treats over time. We know that Parker is selling his dog treats for $10 per bag. His receipts in May are $200, which means he sold 20 bags of dog treats for the month. His receipts are $1700 in October, which means he sold 170 bags in that month.
Surplus or Deficit Answer
In what months does Parker earn a surplus (where total receipts are greater than total disbursements)?
Parker does not start earning a surplus until October. His disbursements are greater than his receipts for all the other months.


Cash Reserve Answer
How much cash reserve will Parker have in November?
Parker’s beginning cash reserve for November would be the ending cash balance in October. Parker ended October with $1,135 in cash. This means his beginning cash reserve for November is $1,135.
6-Month Profit or Loss Answer
What is Parker’s profit or loss during the first six months?
Parker’s profit or loss is his total receipts minus total disbursements. If the number is negative, this means the business lost money. If it is positive, the business makes money.
First, Parker added his monthly total receipts and disbursements for May through October:
- Receipts: $200 + $600 + $900 + $1,000 + $1,300 + $1,700 = $5,700
- Disbursements: $2,190 + $840 + $990 + $1,265 + $1,340 + $1,540 = $8,165
Next, Parker subtracted total disbursements from total receipts:
- $5,700 (receipts) – $8,165 (disbursements) = -$2,465
Parker’s calculations show a loss for the first 6 months in the amount of $2,465. However, the business began operating at a surplus in October. If Parker can continue his current level of sales, he should be in good shape to keep his business going.
Use the “Return to tabs” button below to jump to the tab navigation bar.
Then continue by selecting the next tab in the list.